All data points below compare data through the first Sunday in December of the 2013-14 season to the same time period this year. Note that this season is a week shorter than last, and hence is comparing one fewer week at this time. The numbers are computed on a per team, per game basis.
- Possessions are down 2.17 per team, per game (from 69.9 to 67.7), a decrease of 3.1%.
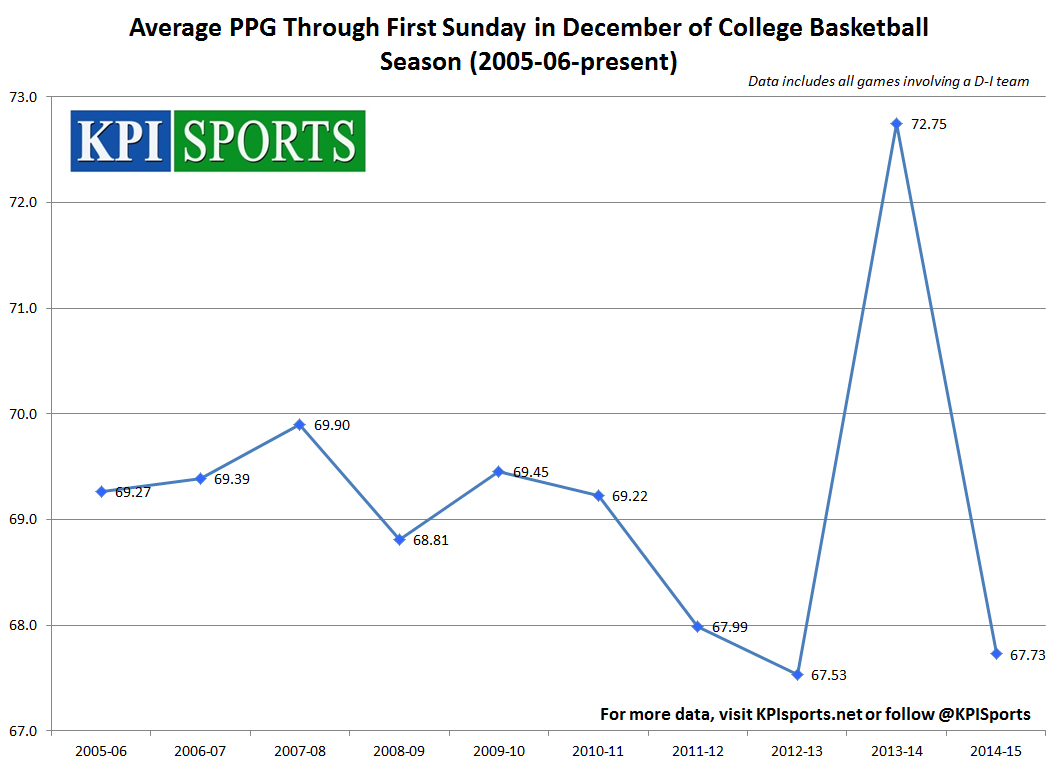
- Scoring is down 5.02 points per team, per game, a decrease of 6.9% (through Dec. 7). With possessions also down, points per possession are down 3.1% (from 1.041 to 1.001).
- 41.1% of the scoring decrease is tied to fewer made free throws and 61.3% from fewer made 2-pt field goals. There has been a slight increase in points coming from made 3-pt field goals (up 2.4%).
- Field Goal Attempts per possession are nearly constant (down 0.2%). but 3-pt field goal attempts per possession are up slightly (4.6%). 34.3% of team’s shots are 3’s this year (up from 32.7% last year), meaning teams are taking more 3’s and less 2’s.
- Free Throw Attempts are down 11.2% (2.61 FTA/game), and down 8.4% per possession.
- Steals per possession are up 7.2% and turnovers per possession are up 8.7%, reversing a trend that was tied directly to the increase in fouls and free throw attempts last year.
- Personal fouls are down 5.0% per game (0.99 per team, per game), down 1.9% per possession.